Case 14: Weather Detection Robot


Introduction

Use the Jacdac temperature & humidity sensor to build a portable weather detection station. Press button A to read the current air humidity via serial output and display it; press button B to read the current temperature and display it. The program continuously monitors the environment automatically: when humidity exceeds 80, the LED matrix displays 「✕」 and a buzzer alarm sounds (excessive humidity); when temperature exceeds 33, it displays a frowny face and a buzzer alarm sounds (excessive temperature).


Learning Objectives

  1. Learn about the temperature & humidity sensor — a fundamental sensor for meteorological observation.
  2. Understand the threshold alarm mechanism — triggering audible and visual alarms when sensor readings exceed set limits.
  3. Explore the basic elements of meteorological observation and the data sources behind weather forecasting.
  4. Learn multi-tasking concurrency — button queries + automatic monitoring running simultaneously.

Required Materials

ItemImageQuantity
micro:bit V21
Jacdac Expansion Board1
Jacdac 25cm Connector Cable1
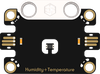
Jacdac Temperature & Humidity Sensor1
USB Cable1

Sensor Principle

Temperature & Humidity Sensor

The Jacdac temperature & humidity sensor integrates both temperature and humidity detection functions, capable of simultaneously outputting ambient temperature and air humidity values.

MeasurementThreshold in This CaseDescription
Temperature> 33°C (alarm) (Note: the 33°C threshold can be adjusted based on local climate)Temperature too high → LED shows frowny face + buzzer alarm
Humidity> 80% (alarm)Humidity too high → LED shows ✕ + buzzer alarm

Temperature and humidity are closely related — as temperature rises, the air's capacity to hold water vapor increases. Hot and humid weather feels oppressively muggy ("sauna weather"), which is why these two parameters are the most critical in meteorological observation.

Assembly Steps


Model Principle

Weather Station — From Stevenson Screen to Microchip

Traditional weather stations use a Stevenson screen (a white louvered wooden box) to house thermometers and hygrometers — the louvered structure ensures ventilation while blocking direct sunlight, ensuring accurate readings. Yet the set of equipment in your hands accomplishes the same task with a chip the size of a fingernail:

ComparisonTraditional Stevenson ScreenJacdac Sensor
Volume~1 cubic meter~2 cubic centimeters
Reading methodManual visual readingDigital output
Recording methodManual recordingAutomatic storage + transmission
Response timeSeveral minutesMilliseconds
CostThousands of yuanTens of yuan

Connection Diagram

As shown below, insert the micro:bit V2 board into the Jacdac expansion board, and use a cable to connect the temperature & humidity sensor to the Jacdac expansion board's edge connector.

Connection Diagram


Programming Software

Microsoft MakeCode


MakeCode Programming

Step 1: Adding the Jacdac Extension

  1. Go to Microsoft MakeCode and click "New Project".

    New Project

  2. Enter a project name in the pop-up window and click "Create".

    Create Project

  3. Click "Extensions" in the code drawer.

    Extensions

  4. In the pop-up interface, type "Jacdac" and click the search icon, then select the Jacdac software library as shown.

    Search Jacdac


Step 2: Connecting the Hardware

  1. Use a USB cable to connect the micro:bit V2 board to the computer.

    Note: If this is the first time running a Jacdac program on the micro:bit V2, please pre-load a blank Jacdac program onto the board first. Otherwise, skip this step.

    Connect micro:bit

  2. Connect the sensor. MakeCode will automatically detect and simulate it in the simulator area, where sensor status is displayed in real time.

    Sensor Simulation

  3. Click "ADD BLOCKS" to add the sensor extension module.

    Note: When connecting a new sensor, repeat the "click 'ADD BLOCKS'" workflow once.

    ADD BLOCKS


Write the Program as Shown

Program Screenshot


https://makecode.microbit.org/_6io7diRHP9tW

You can also download the program directly from the webpage below. Once downloaded, you can start running the program.


Result

Press button A, and the current air humidity value is output via serial (displayed for 5 seconds) for easy data viewing. Press button B, and the current temperature value is output via serial (displayed for 5 seconds). The program continuously monitors in the background automatically: when humidity exceeds 80, the LED matrix displays the 「✕」 icon and the buzzer sounds an alarm — "Humidity too high!" When temperature exceeds 33 (Note: the 33°C threshold can be adjusted based on local climate), it displays a frowny face and the buzzer sounds — "Temperature too high!" Alarms automatically stop once temperature and humidity return to normal.


Think

  1. The alarm in this case triggers on "above threshold" (temperature too high, humidity too high → alarm). What real-world scenarios use "below threshold" triggering? (Hint: smoke alarms, water level alarms)
  2. If you wanted to send temperature and humidity data wirelessly to another micro:bit for remote display, what feature would you need?

Program Logic

Trigger ConditionActionSource
Button A pressedSerial output of humidity sensor reading; wait 5 seconds then returnmicro:bit V2 Button A + Jacdac Temperature & Humidity Sensor
Button B pressedSerial output of temperature sensor reading; wait 5 seconds then returnmicro:bit V2 Button B + Jacdac Temperature & Humidity Sensor
Humidity > 80 (auto-monitoring)LED shows ✕ + buzzer alarm — high humidity warningJacdac Temperature & Humidity Sensor
Temperature > 33 (Note: 33°C threshold adjustable based on local climate) (auto-monitoring)LED shows frowny face + buzzer alarm — high temperature warningJacdac Temperature & Humidity Sensor
Both temperature and humidity normalAll alarm sounds stopJacdac Temperature & Humidity Sensor

Knowledge Extension: Weather Forecasting — From Naked-Eye Observation to Supercomputers

I. A Brief History of Meteorological Observation

Humanity's observation and forecasting of weather has undergone millennia of evolution:

PeriodObservation MethodTypical ToolsForecasting Capability
Ancient timesObserve the sky; read clouds to know weatherNaked eyeWithin hours
17th centuryThermometer and barometer inventedMercury thermometer, mercury barometerQualitative judgment
19th centuryTelegraph networks, weather mapsTelegraph + hand-drawn weather maps1–2 days
Mid 20th centuryRadiosondes, weather radarWeather balloons, radar3–5 days
Late 20th centuryWeather satellites, supercomputersSatellite cloud images, numerical weather prediction7–10 days
21st centuryAI forecasting, IoT sensor networksSmartphone sensors, AI models15+ days

II. Temperature and Humidity — The Two Most Intimate Meteorological Parameters

Temperature (°C)Saturated Water Vapor Content (g/m³)Perceived Comfort
04.8Dry and cold
109.4Cool
2017.3Comfortable
3030.4Muggy
3539.6Oppressively hot

Relative humidity = actual water vapor content ÷ saturated water vapor content at that temperature × 100%. As temperature rises, the air's "water-holding capacity" increases — that's why summer feels muggy (high temperature + high humidity) and winter feels dry (low temperature + low humidity).

III. Threshold Alarms — A Universal Pattern from Meteorology to Daily Life

The logic of "alarm when exceeding a threshold" has countless applications in life:

Application ScenarioMeasured QuantityThresholdAlarm Method
Smoke alarmSmoke particle concentrationExceeds safe levelAudible + visual alarm
Car fuel gaugeRemaining fuelBelow 10%Dashboard warning light
Phone low batteryBattery levelBelow 20%Popup + sound
Flood warningRiver water levelExceeds warning lineBroadcast + SMS
Refrigerator door alarmDoor open timeExceeds 60 secondsBuzzer reminder